We hold many years of experience using open source softwares like using R, RStudio, Shiny...
Why do we choose to make our business with open source tools?
We hold many years of experience using open source software like R to make good analysis of our clients
With us you are sure to get what you want from your data. We are happy to work with you for your business, your research in climate data analysis agriculture, socio-economic data, meteorological data, telecommunication and any kind of big data.
Learn more on our GithubWhy do we choose to make our business with open source tools?
Open-source tools are free to use and even their enterprise versions are reasonably priced compared to their proprietary counterparts. So, with a lower up-front costs, reasonable expenses for training, maintenance and support, and no cost for licensing, open-source analytics tools are much more affordable. More importantly, they’re better value for money
With open-source software, you get complete flexibility: from the way you use your tools, how you combine to build your stack, and even how you use your data. If your requirements change – which, let’s face it, they probably will – you can make the necessary changes without paying extra for customized solutions.
Privacy has become a talking point in many data-related discussions of late. This is thanks, in part, to data protection laws such as the GDPR and CCPA coming into force. High-profile data leaks have also kept the issue high on the agenda. An open-source stack analytics running inside your cloud or on-prem environment gives complete control of your data. This lets you decide which data is to be used when, and how. It lets you dictate how third parties can access and use your data, if at all
These are the tools that we love to use to meet our clients needs.
We are happy to work for you in Exploratory data analysis, dashboard developpement and Ai.
It is about to enerate questions about your data. Search for answers by visualising, transforming, and modelling your data. Use what you learn to refine your questions and/or generate new questions.
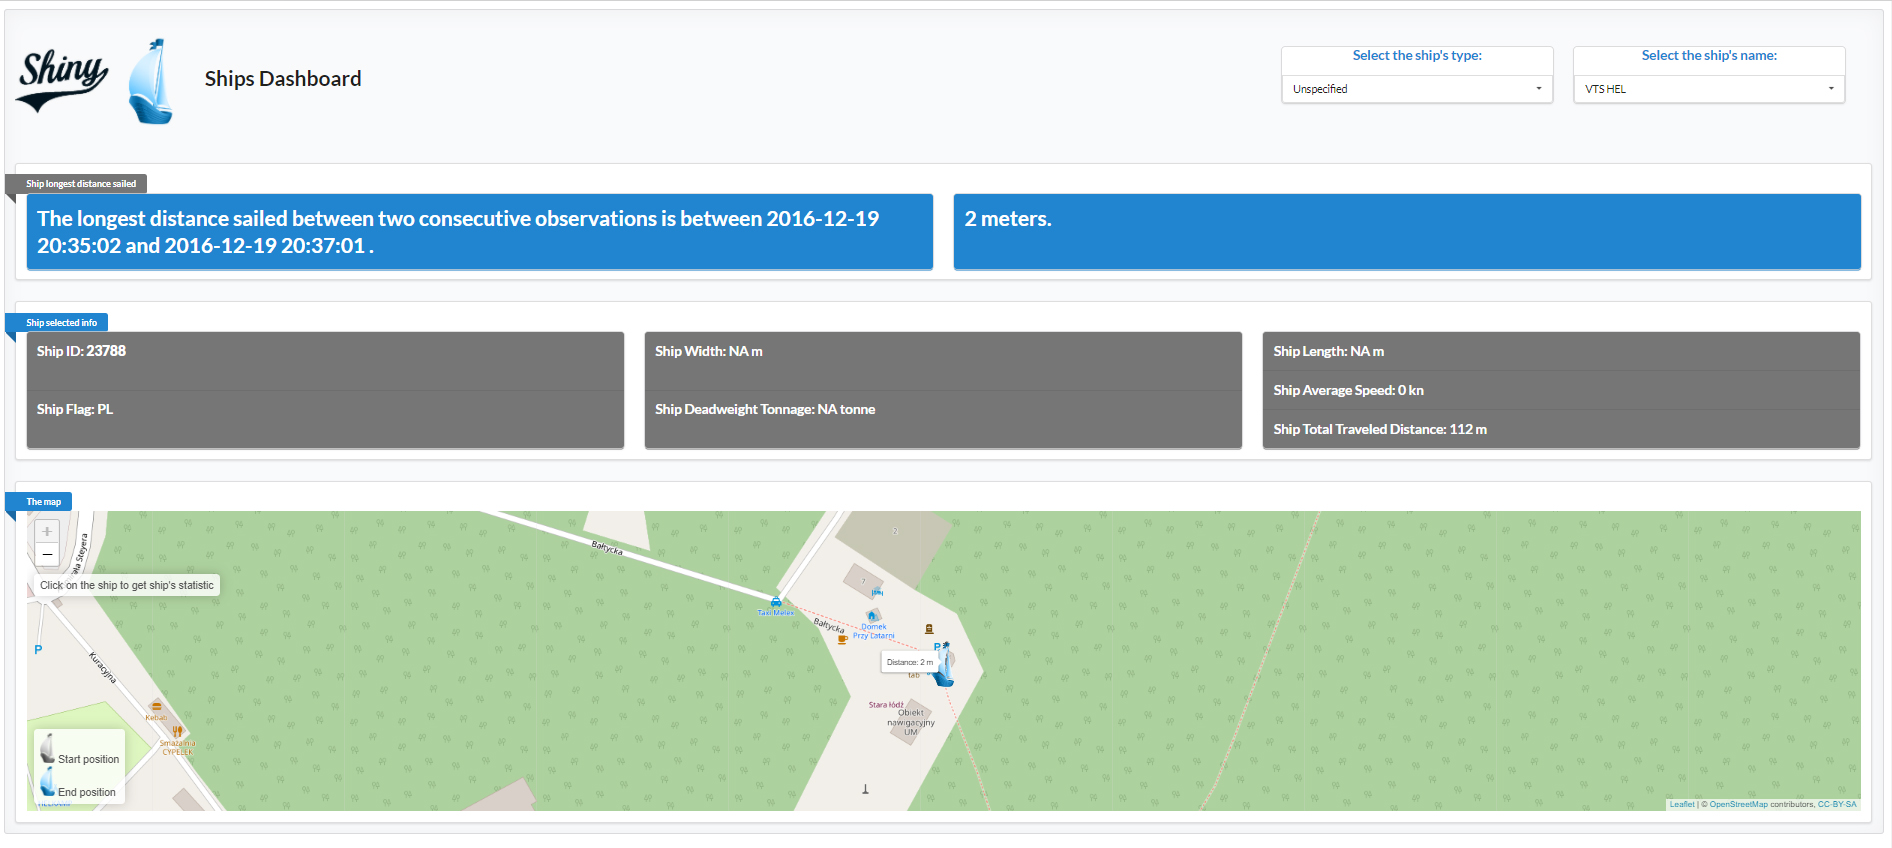
Shiny is an R package that makes it easy to build interactive web apps straight from R. Dashboards are popular since they are good in helping businesses make insights out of the existing data
We use expertise in data science, machine learning and developing artificial intelligence solutions for our clients. We’ve decided to put these technologies to work in resolving the world’s most pressing challenges.
We are here to work for you, taking part of your analysis, training, research or where you find us usefull in your business carreer.
On our github repository you can find more. But here we just want to show one of our dashboards.